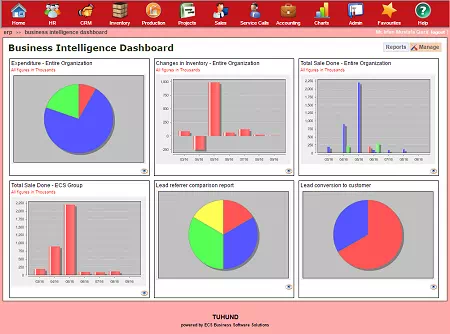
It is not mandatory for all the senior management to view the minutest details of the performance of the organization at various levels. It is a known fact that the management doesn't have the time to sit with you or go through the performance of the organization at granular level. TUHUND's Business Intelligence helps you to describe or present the performance of the company in various graphical representations. You can display the performances of sales and services in various graphical formats such as, pie-chart, graphs, bar and block representations. The management can easily find out where the company stands once they look into these charts and diagrams.
Let it be sales information or a services handling report, you can view the results for a specific period of time in graphical format using the high-end, accurate and result oriented Business intelligence tool of TUHUND. From the graphical representation format you can drill down to the minutest level of information right to the service request or to the individual sales performance. Such is the power of TUHUND's business intelligence module. With TUHUND Business Intelligence module you can:
- View the graphical representation of sales over a period of time
- View the Graphical representation of services handled over a period of time
- Drill-down to the minutest level of sales and services
- View the individual service performances
- View the Individual sales performances
- View the results by branch, state and country level


